
The confidence interval formula serves as a cornerstone in statistical analysis, enabling researchers to estimate the range within which a population parameter is likely to reside. By incorporating sample data along with factors such as sample size and variability, this formula provides a measure of uncertainty surrounding the estimated parameter. Understanding the intricacies of this formula is essential for conducting rigorous statistical inference and drawing reliable conclusions from data. Mastery of this concept empowers researchers to navigate the complexities of uncertainty in their analyses and make informed decisions based on the strength of statistical evidence
Interpreting confidence intervals involves grasping the probabilistic nature of these intervals and their implications for estimating population parameters. A confidence interval of 95%, for instance, indicates that if the sampling process were repeated numerous times, 95% of the intervals constructed would capture the true population parameter. The width of the interval reflects the level of precision in the estimation, with narrower intervals suggesting greater certainty and wider intervals indicating higher uncertainty. Effective interpretation of confidence intervals allows researchers to assess the reliability of their findings and communicate the degree of confidence associated with their estimates to stakeholders and decision-makers.
The process of calculating confidence intervals for means involves employing statistical formulas that account for sample characteristics such as the mean, standard deviation, and sample size. For large sample sizes, the formula typically relies on the standard normal distribution, while for smaller samples, the t-distribution is utilized. These intervals provide researchers with insights into the probable range of values for the population mean based on the sample data. Mastery of this calculation enables researchers to make informed inferences about population parameters and assess the precision of their estimates with confidence.
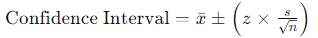
For example, if we have a sample mean (xˉ) of 75, a sample standard deviation (s) of 10, and a sample size (n) of 100, with a desired 95% confidence level (z=1.96), the confidence interval would be 75±(1.96×10/√100), resulting in (73.04, 76.96) as the confidence interval.
Confidence intervals for proportions are essential tools for estimating the range of values for a population proportion based on sample data. The calculation of these intervals involves incorporating the sample proportion, sample size, and the desired level of confidence. These intervals provide researchers with valuable insights into the uncertainty associated with categorical data and enable them to make inferences about population proportions with a specified level of confidence. Understanding how to calculate confidence intervals for proportions equips researchers with the necessary skills to draw meaningful conclusions from their data and communicate findings effectively to stakeholders.
The width of confidence intervals is influenced by several factors, including sample size, variability in the data, and the chosen level of confidence. Larger sample sizes generally result in narrower intervals, as they provide more information about the population parameter. Higher variability or lower confidence levels, however, lead to wider intervals, reflecting increased uncertainty in the estimation. Researchers must consider these factors carefully when interpreting confidence intervals, as they directly impact the precision and reliability of the estimates. By understanding the factors affecting interval width, researchers can optimize study design and ensure the validity of their statistical analyses.
Confidence intervals find wide-ranging applications across various fields, including market research, epidemiology, and quality control. They are utilized to estimate parameters such as population means, proportions, and differences between groups. In market research, for example, confidence intervals are employed to estimate the average customer satisfaction score or the proportion of customers likely to purchase a product. In epidemiology, they help estimate the prevalence of a disease within a population. Understanding the diverse applications of confidence intervals enables researchers to harness their power in different contexts and make informed decisions based on reliable statistical evidence.

Comparing confidence intervals allows researchers to assess differences between groups or populations and determine the significance of these differences. When intervals do not overlap, it suggests a statistically significant difference between the corresponding parameters. Conversely, overlapping intervals indicate less certainty regarding differences, requiring further investigation or analysis. Understanding how to compare confidence intervals is essential for drawing valid conclusions from statistical comparisons and making informed decisions based on the strength of evidence. Researchers must interpret the results of interval comparisons carefully, considering factors such as sample size and variability, to ensure the validity and reliability of their finding
Suppose we're comparing two teaching methods with Group A having a mean of 80 and Group B with a mean of 85, both with sample sizes of 50.
Calculate the confidence intervals for both groups using the given formula.
If the confidence intervals overlap, it suggests no significant difference in means.
If they don't overlap, further investigation is warranted to understand the difference's significance.
Common mistakes in confidence interval calculation can undermine the validity and reliability of statistical analyses. These errors include misinterpreting confidence levels, using inappropriate sample sizes, and misunderstanding underlying assumptions. For instance, incorrectly specifying the confidence level can lead to intervals that are too wide or too narrow, affecting the accuracy of the estimates. Similarly, using a sample size that is too small may result in intervals that fail to capture the true population parameter. By recognizing and avoiding these common mistakes, researchers can conduct more robust statistical analyses and draw reliable conclusions from their data.
Advanced topics in confidence intervals expand upon the foundational principles to address complex research questions and analytical challenges. Bayesian inference, for example, incorporates prior knowledge into interval estimation, allowing researchers to refine their estimates based on existing information. Bootstrapping techniques enable non-parametric estimation of intervals, particularly useful when underlying assumptions are not met. Meta-analysis combines results from multiple studies to derive more precise estimates of population parameters. Understanding these advanced topics enhances the versatility of confidence interval methodology and equips researchers with powerful tools to tackle a wide range of analytical tasks effectively.
A confidence interval is a range of values that likely contains the true population parameter.
Confidence intervals are calculated using sample statistics and a chosen confidence level.
A 95% confidence interval means there's a 95% chance it contains the true population parameter.
Sample size, variability, and confidence level affect the width of a confidence interval.
Confidence intervals are used to estimate population parameters with uncertainty.
Confidence intervals estimate population parameters, while prediction intervals forecast future observations.
A confidence interval represents a range where the true parameter likely lies.
The confidence level indicates the probability the interval contains the true parameter.
It suggests no statistically significant difference or effect in the parameter.
Compare if they overlap; non-overlapping intervals suggest a significant difference.