Direct variation, also known as proportionality, describes a mathematical relationship where one variable increases or decreases in direct proportion to another variable, maintaining a constant ratio between them. This concept is foundational in algebra and is represented by the equation y = kx, where y is the dependent variable, x is the independent variable, and k is the constant of proportionality. Understanding direct variation enables the modeling of various real-world phenomena, such as the relationship between distance and time or the amount of paint required to cover a surface area. By grasping this concept, one can analyze and predict how changes in one variable affect the other, making it a vital tool in mathematical problem-solving and scientific inquiry.
In mathematics, a direct variation equation represents a linear relationship between two variables, where one variable is directly proportional to the other. The equation takes the form y = kx, where y represents the dependent variable, x represents the independent variable, and k is the constant of proportionality. This equation indicates that as the independent variable changes, the dependent variable changes in direct proportion, with the constant k determining the relationship's steepness. By manipulating direct variation equations, mathematicians can solve problems involving proportional relationships, such as determining the cost of an item based on its weight or predicting future population growth based on current trends. Understanding and utilizing direct variation equations are essential skills for mastering algebra and applying mathematical concepts to real-world scenarios.
1. Given:
Cost (C) = $50
Number of Flyers (n) = 500
2. Using the direct variation equation y=kx, where y represents the cost and x represents the number of flyers, we can solve for k:
50=k×500
3. Solving for k:
k= 50/500=0.1
4. Now, we have the value of k. Thus, the direct variation equation for this scenario is:
C=0.1n
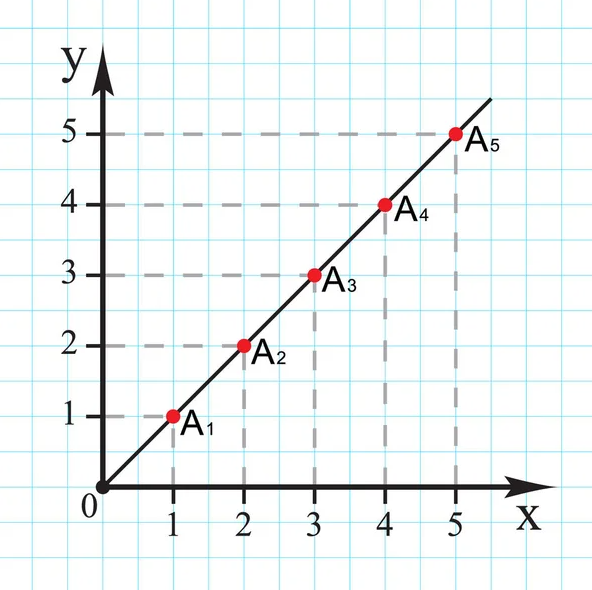
Graphical representation is a powerful tool for visualizing direct variation relationships between two variables. In a direct variation scenario, plotting the data on a graph typically results in a straight line passing through the origin (0,0) on a Cartesian plane. The slope of this line represents the constant of proportionality, indicating how much the dependent variable changes for a unit change in the independent variable. A steeper slope signifies a stronger direct variation relationship, while a shallower slope indicates a weaker relationship. Analyzing the graphical representation of direct variation allows for a visual interpretation of the relationship between variables, aiding in data analysis, trend identification, and prediction making. This graphical approach enhances understanding and facilitates communication of direct variation concepts across various fields and applications.
Direct variation finds extensive applications across various disciplines, including physics, economics, engineering, and more. In physics, direct variation is prevalent in laws such as Hooke's Law, which describes the relationship between the force applied to a spring and the resulting displacement. In economics, direct variation is evident in concepts like the law of demand, where the quantity demanded of a good varies directly with its price. Engineers often encounter direct variation when analyzing systems with proportional responses, such as voltage and current in electrical circuits. Understanding and applying direct variation allows professionals in these fields to model relationships between variables, make predictions, and solve complex problems effectively, contributing to advancements in science, technology, and economics.
In mathematics, inverse variation and direct variation are two distinct types of relationships between variables. In direct variation, as one variable increases, the other variable increases proportionally, maintaining a constant ratio. Conversely, in inverse variation, as one variable increases, the other variable decreases proportionally, while their product remains constant. For example, the relationship between speed and travel time exhibits direct variation, whereas the relationship between the number of workers and the time to complete a task demonstrates inverse variation. Distinguishing between these two types of relationships is crucial for correctly interpreting mathematical models and solving problems in algebra and related fields, enabling mathematicians to make accurate predictions and analyze data effectively.
Direct variation word problems involve real-life scenarios where one quantity varies directly with another, providing practical applications for understanding direct variation concepts. For instance, consider a scenario where the time taken to complete a task is directly proportional to the number of workers assigned to it. In this case, as the number of workers increases, the time taken to complete the task decreases proportionally. Similarly, the amount of paint required to cover a surface area varies directly with the size of the area to be painted. By solving direct variation word problems, students and professionals develop critical thinking skills, apply mathematical concepts to real-world situations, and gain a deeper understanding of how variables interact and influence outcomes in various contexts.
1. Given:
Time (t) = 8 hours
Number of Pumps (p) = 4
2. We can use the direct variation equation t=kp to solve for k:
8=k×4
3. Solving for k:
k= 8/4=2
4. Now that we have k, we can use it to find the time t with 6 pumps:
t=2×6=12 hours
Answer: It will take 12 hours to fill the swimming pool using 6 pumps.
These examples demonstrate the application of the direct variation equation and its use in solving word problems involving proportional relationships.
Direct variation and proportionality are closely related mathematical concepts that describe relationships between variables. In direct variation, the ratio between two variables remains constant as one variable changes, while in proportionality, the two variables are equal. For example, if the speed of a car is directly proportional to the distance traveled, doubling the distance will result in a doubling of the speed. However, in a proportional relationship, doubling the distance will result in the speed being halved to maintain equality. Understanding the distinction between direct variation and proportionality is essential for interpreting mathematical models, analyzing data, and making predictions in various contexts, including science, economics, and engineering.
Direct variation plays a significant role in scientific disciplines, providing a framework for understanding and modeling relationships between variables. In physics, direct variation is evident in fundamental laws such as Newton's Second Law, which states that the force acting on an object is directly proportional to its acceleration. Similarly, in chemistry, Boyle's Law describes the inverse relationship between the volume and pressure of a gas, demonstrating a form of direct variation. By recognizing and applying direct variation principles, scientists can formulate hypotheses, conduct experiments, and analyze data to uncover underlying patterns and relationships in the natural world. This understanding contributes to advancements in scientific knowledge and technological innovation across various fields.
Mastering direct variation involves developing problem-solving strategies and techniques to effectively apply the concept in different contexts. One approach is to thoroughly understand the relationship between variables and recognize patterns that indicate direct variation. Additionally, practicing with a variety of direct variation problems, including word problems and graphical representations, helps reinforce comprehension and build confidence in solving them. Utilizing visualization tools and technology can aid in conceptualizing direct variation relationships and making connections between mathematical concepts and real-world scenarios. By incorporating these tips and tricks into study routines, students can enhance their proficiency in direct variation and develop critical thinking skills applicable to a wide range of mathematical and scientific endeavors.
Direct variation describes a relationship where one variable changes in proportion to another, maintaining a constant ratio.
The direct variation equation is y=kx, where y and x are variables, and k is the constant of proportionality.
Direct variation is identified by observing if changes in one variable result in proportional changes in another, with a constant ratio.
The constant of proportionality (k) represents the ratio between the variables in a direct variation relationship.
An example is the relationship between distance traveled and time taken, where speed remains constant.
Graph direct variation by plotting ordered pairs on a Cartesian plane, resulting in a straight line passing through the origin.
In direct variation, both variables change in the same direction, while in inverse variation, one increases as the other decreases.
Examples include physics (force and acceleration), economics (supply and demand), and engineering (voltage and current).
Identify variables, set up a proportion using y=kx, and solve for the unknown quantity.
Yes, as long as the relationship between each variable and the others remains proportional.